Ehra · Harm Reduction/
A data-driven web platform for the Eurasian Harm Reduction Association — interactive maps, dashboards, and visual reports that make public-health research accessible across Eurasia.
Browse the project/
Swipe through the shipped surfaces — one screen at a time.

Public-health research, made readable/
Harm-reduction data is usually buried in PDFs. Ehra needed a platform where a policy reader, a researcher, or a journalist could see country-level data and dig into it.
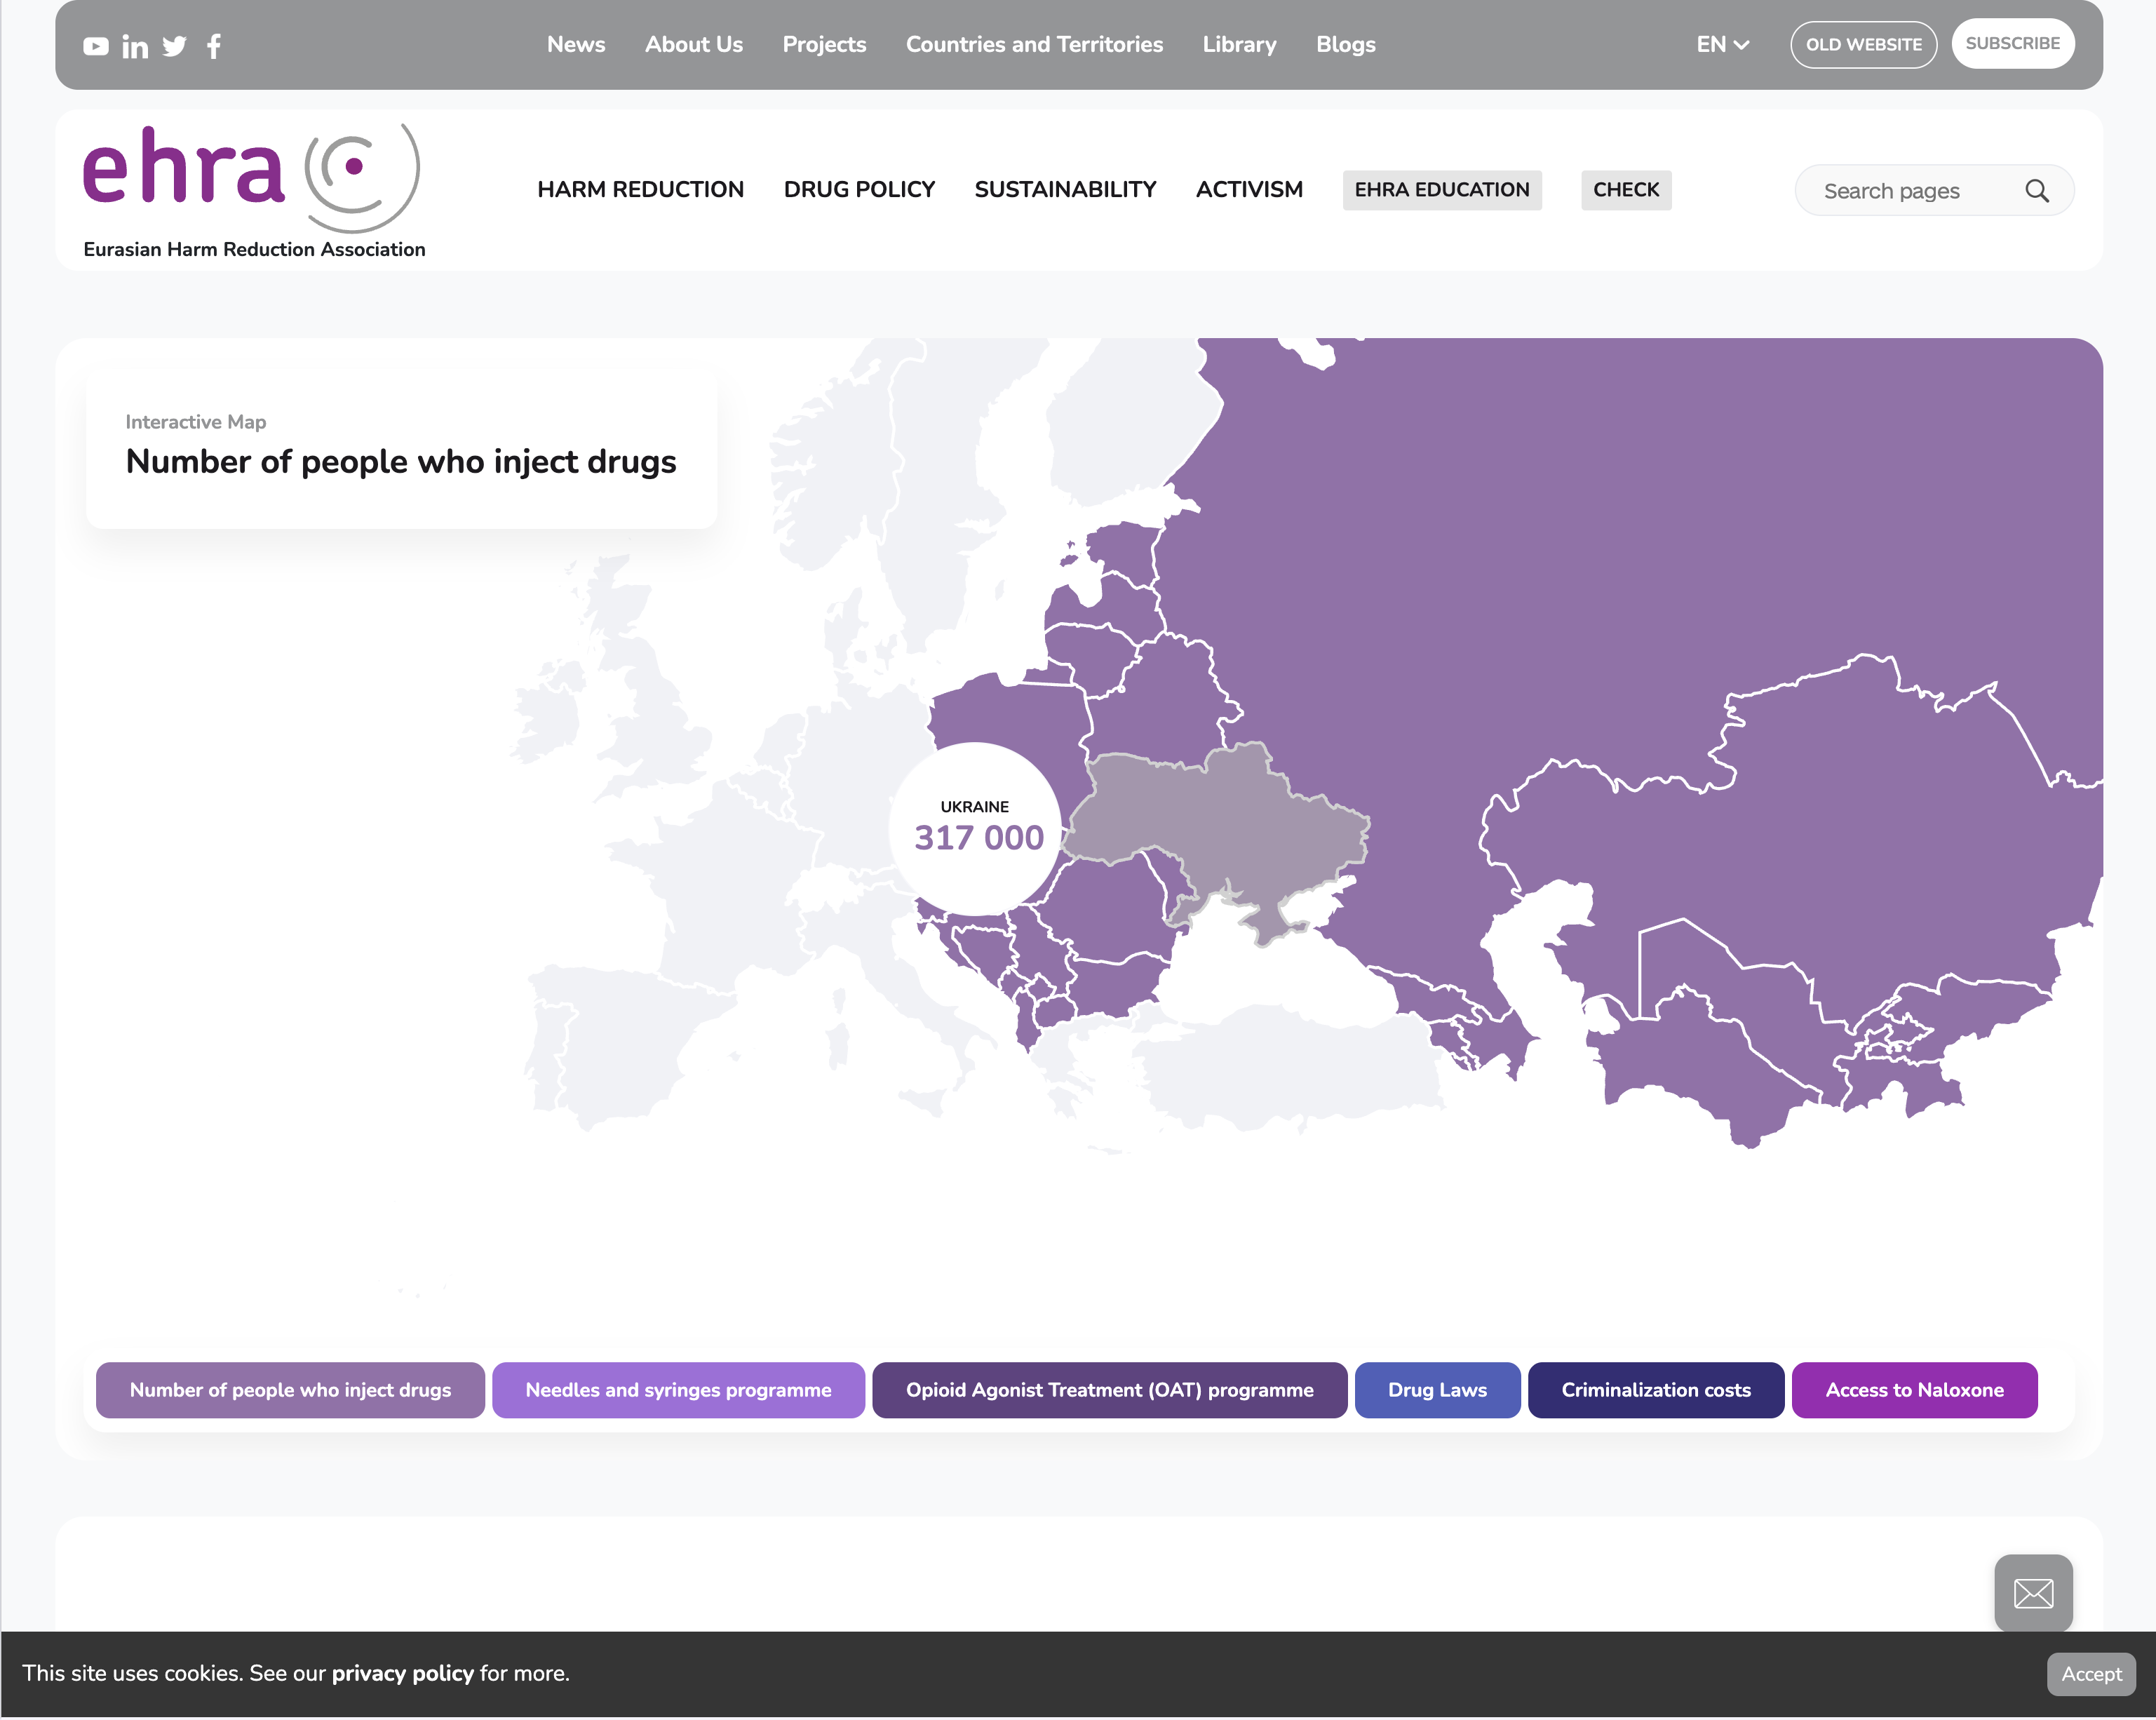
The platform turns EHRA's research into a navigable web product. The centerpiece is an interactive map of Eurasia where each country surfaces indicators across needle/syringe programs, OAT (opioid agonist treatment), drug law, criminalization costs, naloxone access, and people-who-inject-drugs estimates.
I built the React front-end (map, dashboard, country profile), the NestJS API serving the data layer, and the DocuSign workflow for partner agreements. The data model is structured so a researcher can add a new indicator without a code change.
Sensitive subject matter, multiple languages, and accessibility were first-class constraints — not afterthoughts.
Eurasia, one indicator at a time/
The map shades countries by the selected indicator — people who inject drugs, needle/syringe programs, OAT programmes, drug laws, criminalization costs, access to naloxone. Each tile is a tooltip; each country is a profile.
- Country-level choropleth with switchable indicators
- Keyboard- and screen-reader-friendly
- Click into country profile for context
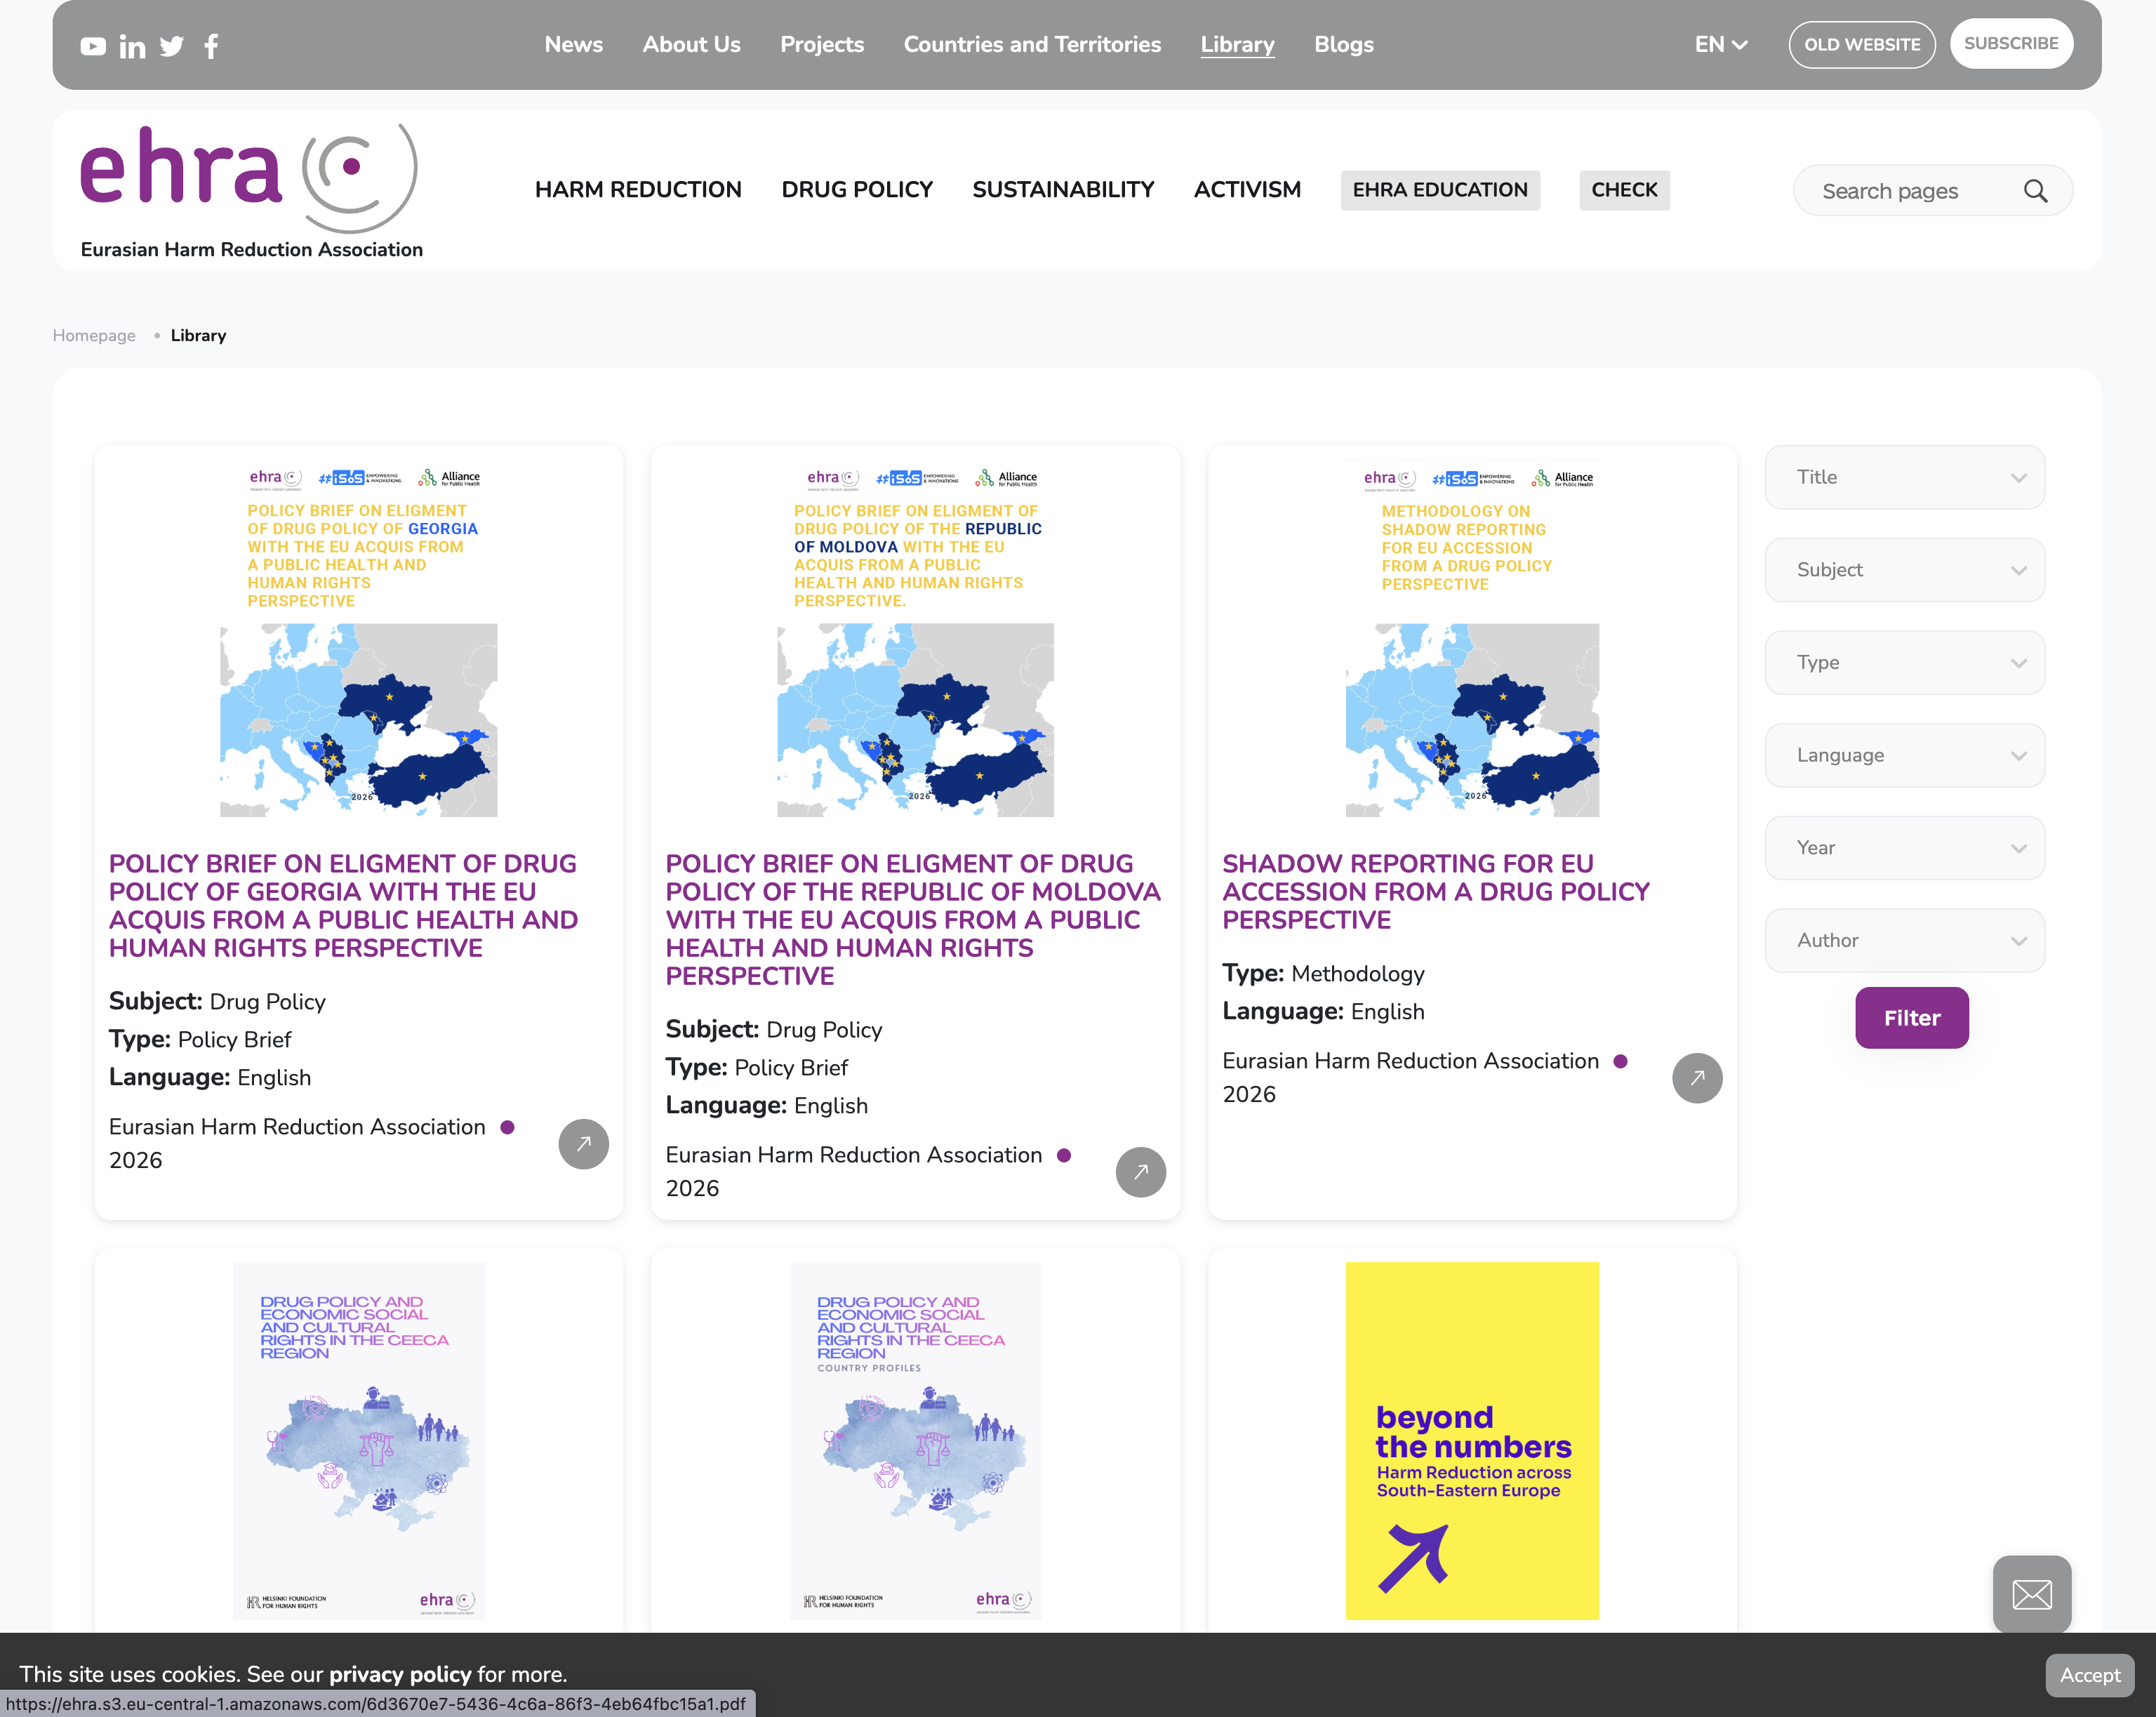
Country pages with the receipts/
Every country has a profile page with all indicators in one view, with sources cited. The profile is designed for citation — policy briefs and journalists can deep-link directly to a country.
- All indicators on one page
- Source citations per data point
- Deep-linkable per country and indicator

Adding new indicators without redeploys/
Researchers add indicators and country data through an admin surface. New indicators light up on the map without a code change — just a metadata definition + data import.
- Indicator metadata as data
- CSV / XLSX import for country values
- Map-legend generation is automatic
From map to policy brief/
A walk through the public surfaces of the platform.
Make hard data feel approachable/
If you're a non-profit, public-health org, or research team that wants your data to be more than a PDF — I'd love to help.